What Is the Evidence Pyramid for Systematic Reviews? (Beginner Guide)
TL;DR
The evidence pyramid ranks study designs by their typical risk of bias. It is useful for planning and interpretation, but it is not a quality score for individual studies.
Key rule:
- level of evidence = starting design strength
- quality/risk of bias = how well a specific study was actually done
What the evidence pyramid is
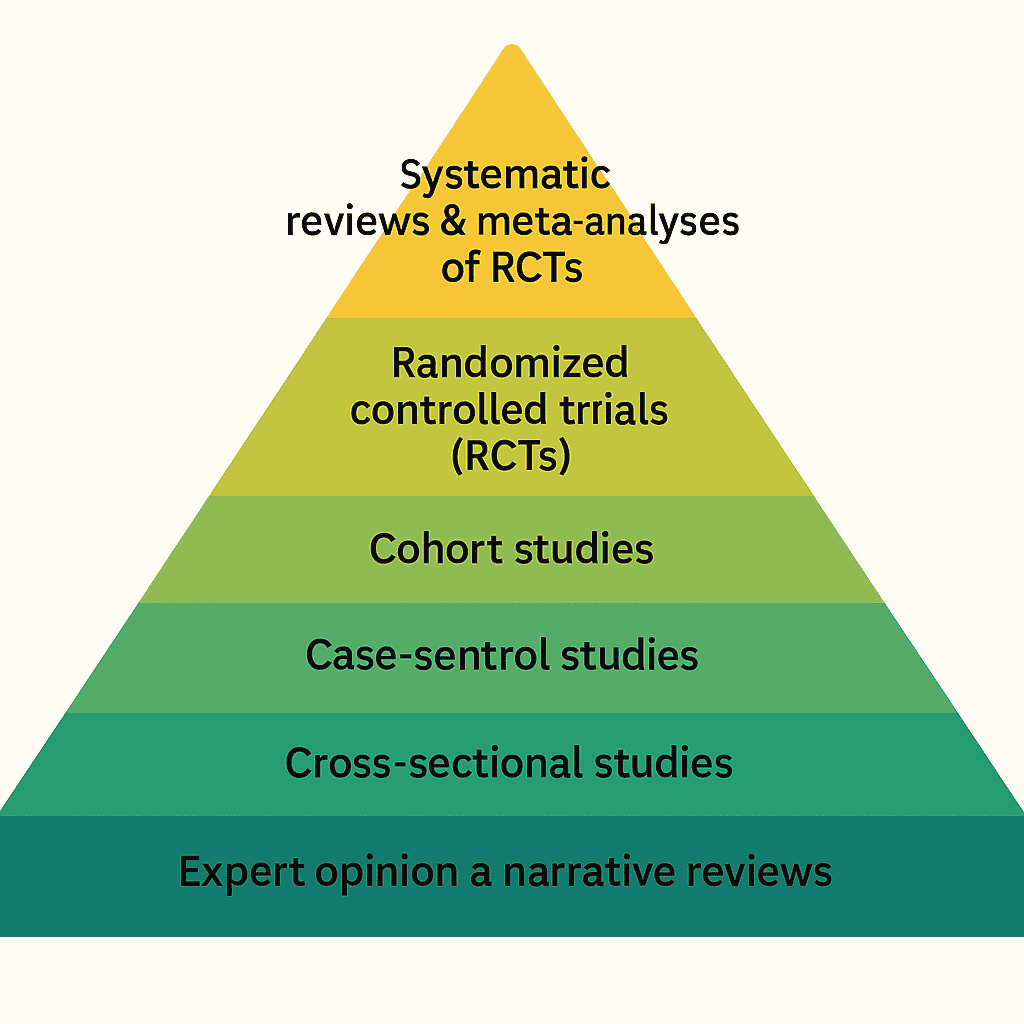
The evidence pyramid is a hierarchy of study designs. For intervention questions, it usually places:
- systematic reviews/meta-analyses and RCTs near the top
- observational studies in middle layers
- case reports and expert opinion near the bottom
It helps you anticipate how strong causal claims can be.
One sentence for your protocol
Use this wording in plain language: “Design hierarchy tells us where causal inference usually starts; risk-of-bias and certainty methods tell us where we end up after reading the actual studies.”
Why beginners find it useful
It helps with four early decisions:
- which designs to prioritize in inclusion criteria
- what to expect from the literature landscape
- how to frame confidence in conclusions
- how to structure evidence tables for synthesis
If you are new to full workflow design, pair this with What Are the 7 Steps of a Systematic Review?.
Not all pyramids are the same diagram
You may see slightly different “layers” depending on the source (teaching diagrams vs formal levels-of-evidence frameworks). Common ideas still apply:
- Teaching pyramids simplify messaging: RCTs and systematic reviews float upward; mechanistic and narrative evidence sink downward.
- Oxford CEBM 2009 levels (and later updates) formalize levels of evidence for questions beyond treatment effects—diagnosis, prognosis, harm, and economic evidence each shift which designs sit where.
For a single intervention review, the practical question is narrower: which eligible designs can support the causal claim your review question implies? Everything else is commentary unless your scope explicitly widens.
When the pyramid shape changes (same idea, different ordering)
| Review question type | Why the default “RCT on top” picture can mislead |
|---|---|
| Treatment efficacy / harm | RCTs and high-quality overviews often lead, but harms and long-term outcomes still need careful appraisal. |
| Diagnostic accuracy | Cross-sectional or cohort designs comparing test to reference standard may dominate; “RCT at top” is the wrong mental model. |
| Prognosis | Longitudinal cohorts may be the best available evidence even when no trial exists. |
| Qualitative evidence | Synthesis of qualitative studies answers different questions; design “levels” from trials do not replace methodological rigor frameworks for qualitative work. |
Takeaway: the pyramid is a map of typical starting strength, not a universal ladder stamped on every clinical question.
Where people misuse it
Mistake 1: assuming top-level design means high quality
A weakly run RCT can be less trustworthy than a strong cohort study.
Mistake 2: dismissing lower-level evidence completely
For rare conditions or early technologies, lower-level evidence may be the only available evidence.
Mistake 3: using hierarchy as the final verdict
Design hierarchy should be combined with risk-of-bias assessment and certainty reasoning.
Mistake 4: counting studies instead of information
Ten small, biased trials do not automatically outrank one well-conducted study that directly matches your PICO and outcomes.
Pyramid vs quality assessment
Think of it like this:
- pyramid = map of where evidence starts
- risk-of-bias tool = check of how evidence was produced
- certainty approach (for example GRADE) = integrated confidence judgment
For tool selection, use How to Choose the Right Quality Assessment Tool.
Glossary (quick reference)
| Term | Plain-language meaning |
|---|---|
| Study design | Planned structure of the study (trial, cohort, case-control, etc.). |
| Risk of bias | Systematic ways the study could deviate from the truth (selection, performance, detection, attrition, reporting, confounding). |
| Precision | How tight estimates are; often driven by sample size and event counts. |
| Directness | How closely outcomes, populations, interventions, and comparators match what you care about in practice. |
| Consistency | Whether separate studies point in the same direction. |
How to use the pyramid in real reviews
During protocol design
Specify which designs are eligible and why.
During screening
Tag study design early to understand evidence mix.
During extraction
Capture design and key quality fields in the same table.
During synthesis
Interpret effects in light of design strength and bias risk, not just p-values.
Linking hierarchy to evidence tables
In practice, teams that separate design label from appraisal result avoid the most common pyramid mistakes:
- One column (or structured field) for design type (RCT, non-randomized comparative study, cohort, etc.).
- Separate fields for risk-of-bias domain judgments and an overall appraisal.
- Outcome-level notes where indirectness or imprecision matters for GRADE-style reasoning.
That structure mirrors how Evidence Table Builder is intended to be used: keep extraction structured enough that downstream quality and certainty judgments are traceable in the same row as the effect estimate or narrative finding.
Quick practical checklist
- Have we defined eligible design types in protocol?
- Do we track design type as a structured field?
- Do we assess risk of bias separately from design level?
- Are conclusions aligned with certainty, not only study count?
- Have we stated which “pyramid” logic applies to our question type (treatment vs diagnosis vs prognosis)?
If any answer is no, your hierarchy logic is probably incomplete.
Frequently asked questions
Does “higher on the pyramid” always mean “include it, lower means exclude it”?
No. Eligibility is a protocol decision. Some reviews intentionally include lower-level evidence when trials are sparse, with explicit rules for interpretation.
Should we use the pyramid instead of RoB 2 or ROBINS-I?
No. The pyramid is not a substitute for domain-based risk-of-bias tools. At best it informs which tool family you are likely to need.
Do systematic reviews always sit “above” RCTs?
Not automatically. A systematic review is only as trustworthy as its included studies, methods, and risk-of-bias assessments across studies. A bad overview can mislead faster than a single good trial.
Where does GRADE fit?
GRADE (or similar) integrates risk of bias, inconsistency, indirectness, imprecision, and publication bias for quantitative estimates—exactly the dimensions the pyramid does not encode by itself.
Final thought
The evidence pyramid is a useful starting framework, not a decision machine. Use it to orient your review, then combine it with structured extraction and quality appraisal to make defensible conclusions.
Related reading
Tags:

About the Author
Connect on LinkedInGeorge Burchell
George Burchell is a specialist in systematic literature reviews and scientific evidence synthesis with significant expertise in integrating advanced AI technologies and automation tools into the research process. With over four years of consulting and practical experience, he has developed and led multiple projects focused on accelerating and refining the workflow for systematic reviews within medical and scientific research.