What is an Evidence Table?
What is an Evidence Table?
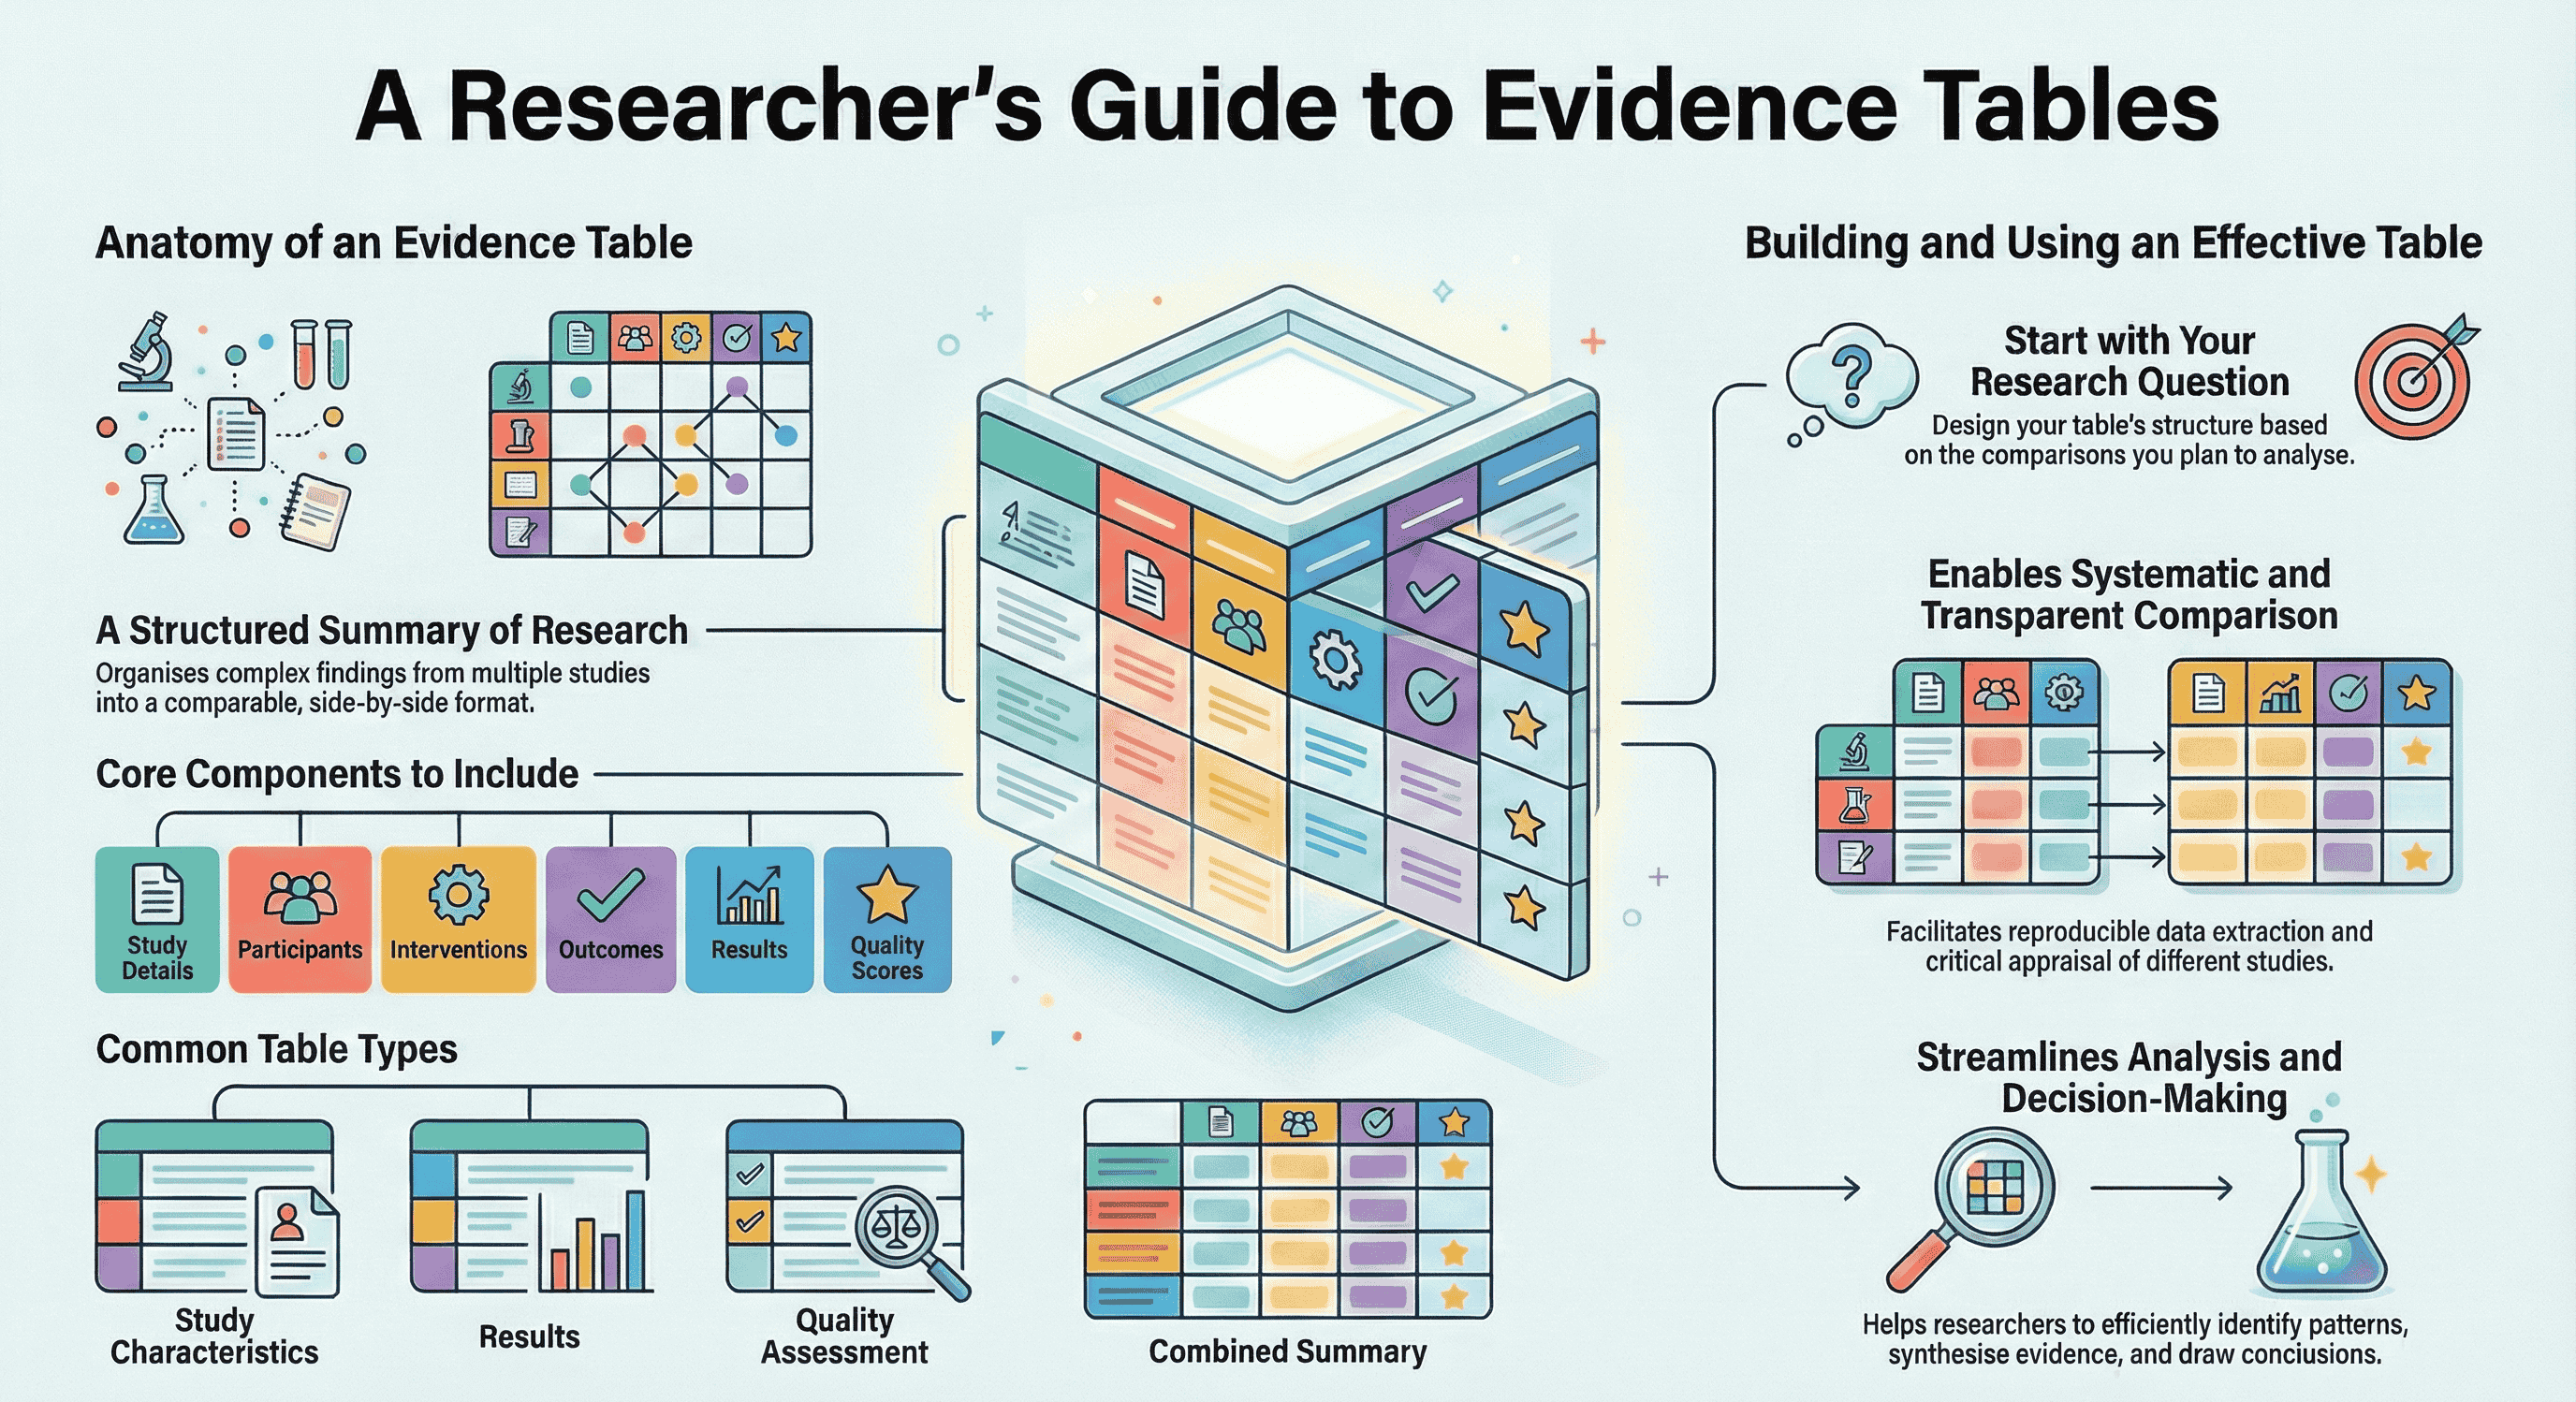
Evidence tables are structured summaries of data extracted from multiple research studies. They transform complex findings into organized, comparable formats that support systematic reviews and meta-analyses by enabling side-by-side comparison of study characteristics, methods, and results.
If you’re building your first table, start here: Getting Started with Evidence Tables.
Core Components
Most evidence tables include:
- Study Identification: Author, year, title, journal, and location
- Study Characteristics: Design (RCT, cohort, etc.), sample size, duration, and funding
- Participants: Demographics, inclusion criteria, and baseline characteristics
- Interventions: Treatment details, dosages, and control groups (for intervention studies)
- Outcomes: Primary/secondary measures, definitions, and assessment methods
- Results: Effect sizes, confidence intervals, and adverse events
- Quality Assessment: Risk of bias ratings and methodological quality scores
Evidence Table Example (Table of Evidence Template)
Here’s a simple “table of evidence” template you can adapt. Each row is one study; each column is one variable you’ll later want to compare or analyse.
| Study (Author, Year) | Design | Population (n) | Intervention / Exposure | Comparator | Outcome (definition + timepoint) | Result (effect size + CI) | Risk of bias | Notes |
|---|---|---|---|---|---|---|---|---|
| Smith 2022 | RCT | 120 | Drug A 10mg daily | Placebo | Pain score (12 weeks) | MD -1.2 (95% CI -1.9 to -0.5) | Some concerns | Outcome definition differed |
If you want a column-by-column breakdown (and why some “standard” columns cause rework later), use: What Columns Should an Evidence Table for a Systematic Review Include?.
Evidence Table Types (Including an Evidence Summary Table)
Types include:
- Descriptive tables (study characteristics)
- Results tables (outcome data)
- Quality assessment tables (risk of bias)
- Combined tables (comprehensive summaries)
Benefits:
- Enable systematic comparison across studies
- Facilitate transparent, reproducible data extraction
- Support critical appraisal and quality assessment
- Streamline pattern identification and decision-making
Creating Effective Evidence Tables
To create useful evidence tables:
- Start with your research question - Design backwards from your planned analysis to ensure the table supports meaningful comparisons
- Read your studies first - Understand the landscape before committing to columns
- Structure systematically - Include study characteristics, demographics, and comparable outcomes
- Standardize data - Use consistent terminology and harmonize units across studies
- Present clearly - Use formatting that enhances readability and supports your analysis goals
If you’re deciding what to extract and how to structure it, this is the next best read: What Columns Should an Evidence Table for a Systematic Review Include?.
For a detailed workflow on analysis-driven table design, see: Analysis-Driven Design of Evidence Tables.
Modern Evidence Tables
Digital tools are transforming evidence tables with interactive features, automated data extraction, and collaborative capabilities. Platforms like Evidence Table Builder streamline the creation process, making evidence synthesis more efficient and reproducible. Learn how to maximize EvidenceTableBuilder specifically for systematic literature reviews: How Best to Use EvidenceTableBuilder for Systematic Literature Reviews
Evidence tables remain essential for systematic reviews, enabling researchers to organize complex data, facilitate critical analysis, and communicate findings transparently in our evidence-based world.
Related reading
Tags:

About the Author
Connect on LinkedInGeorge Burchell
George Burchell is a specialist in systematic literature reviews and scientific evidence synthesis with significant expertise in integrating advanced AI technologies and automation tools into the research process. With over four years of consulting and practical experience, he has developed and led multiple projects focused on accelerating and refining the workflow for systematic reviews within medical and scientific research.