What Are the 7 Steps of a Systematic Review? A Beginner Workflow
TL;DR
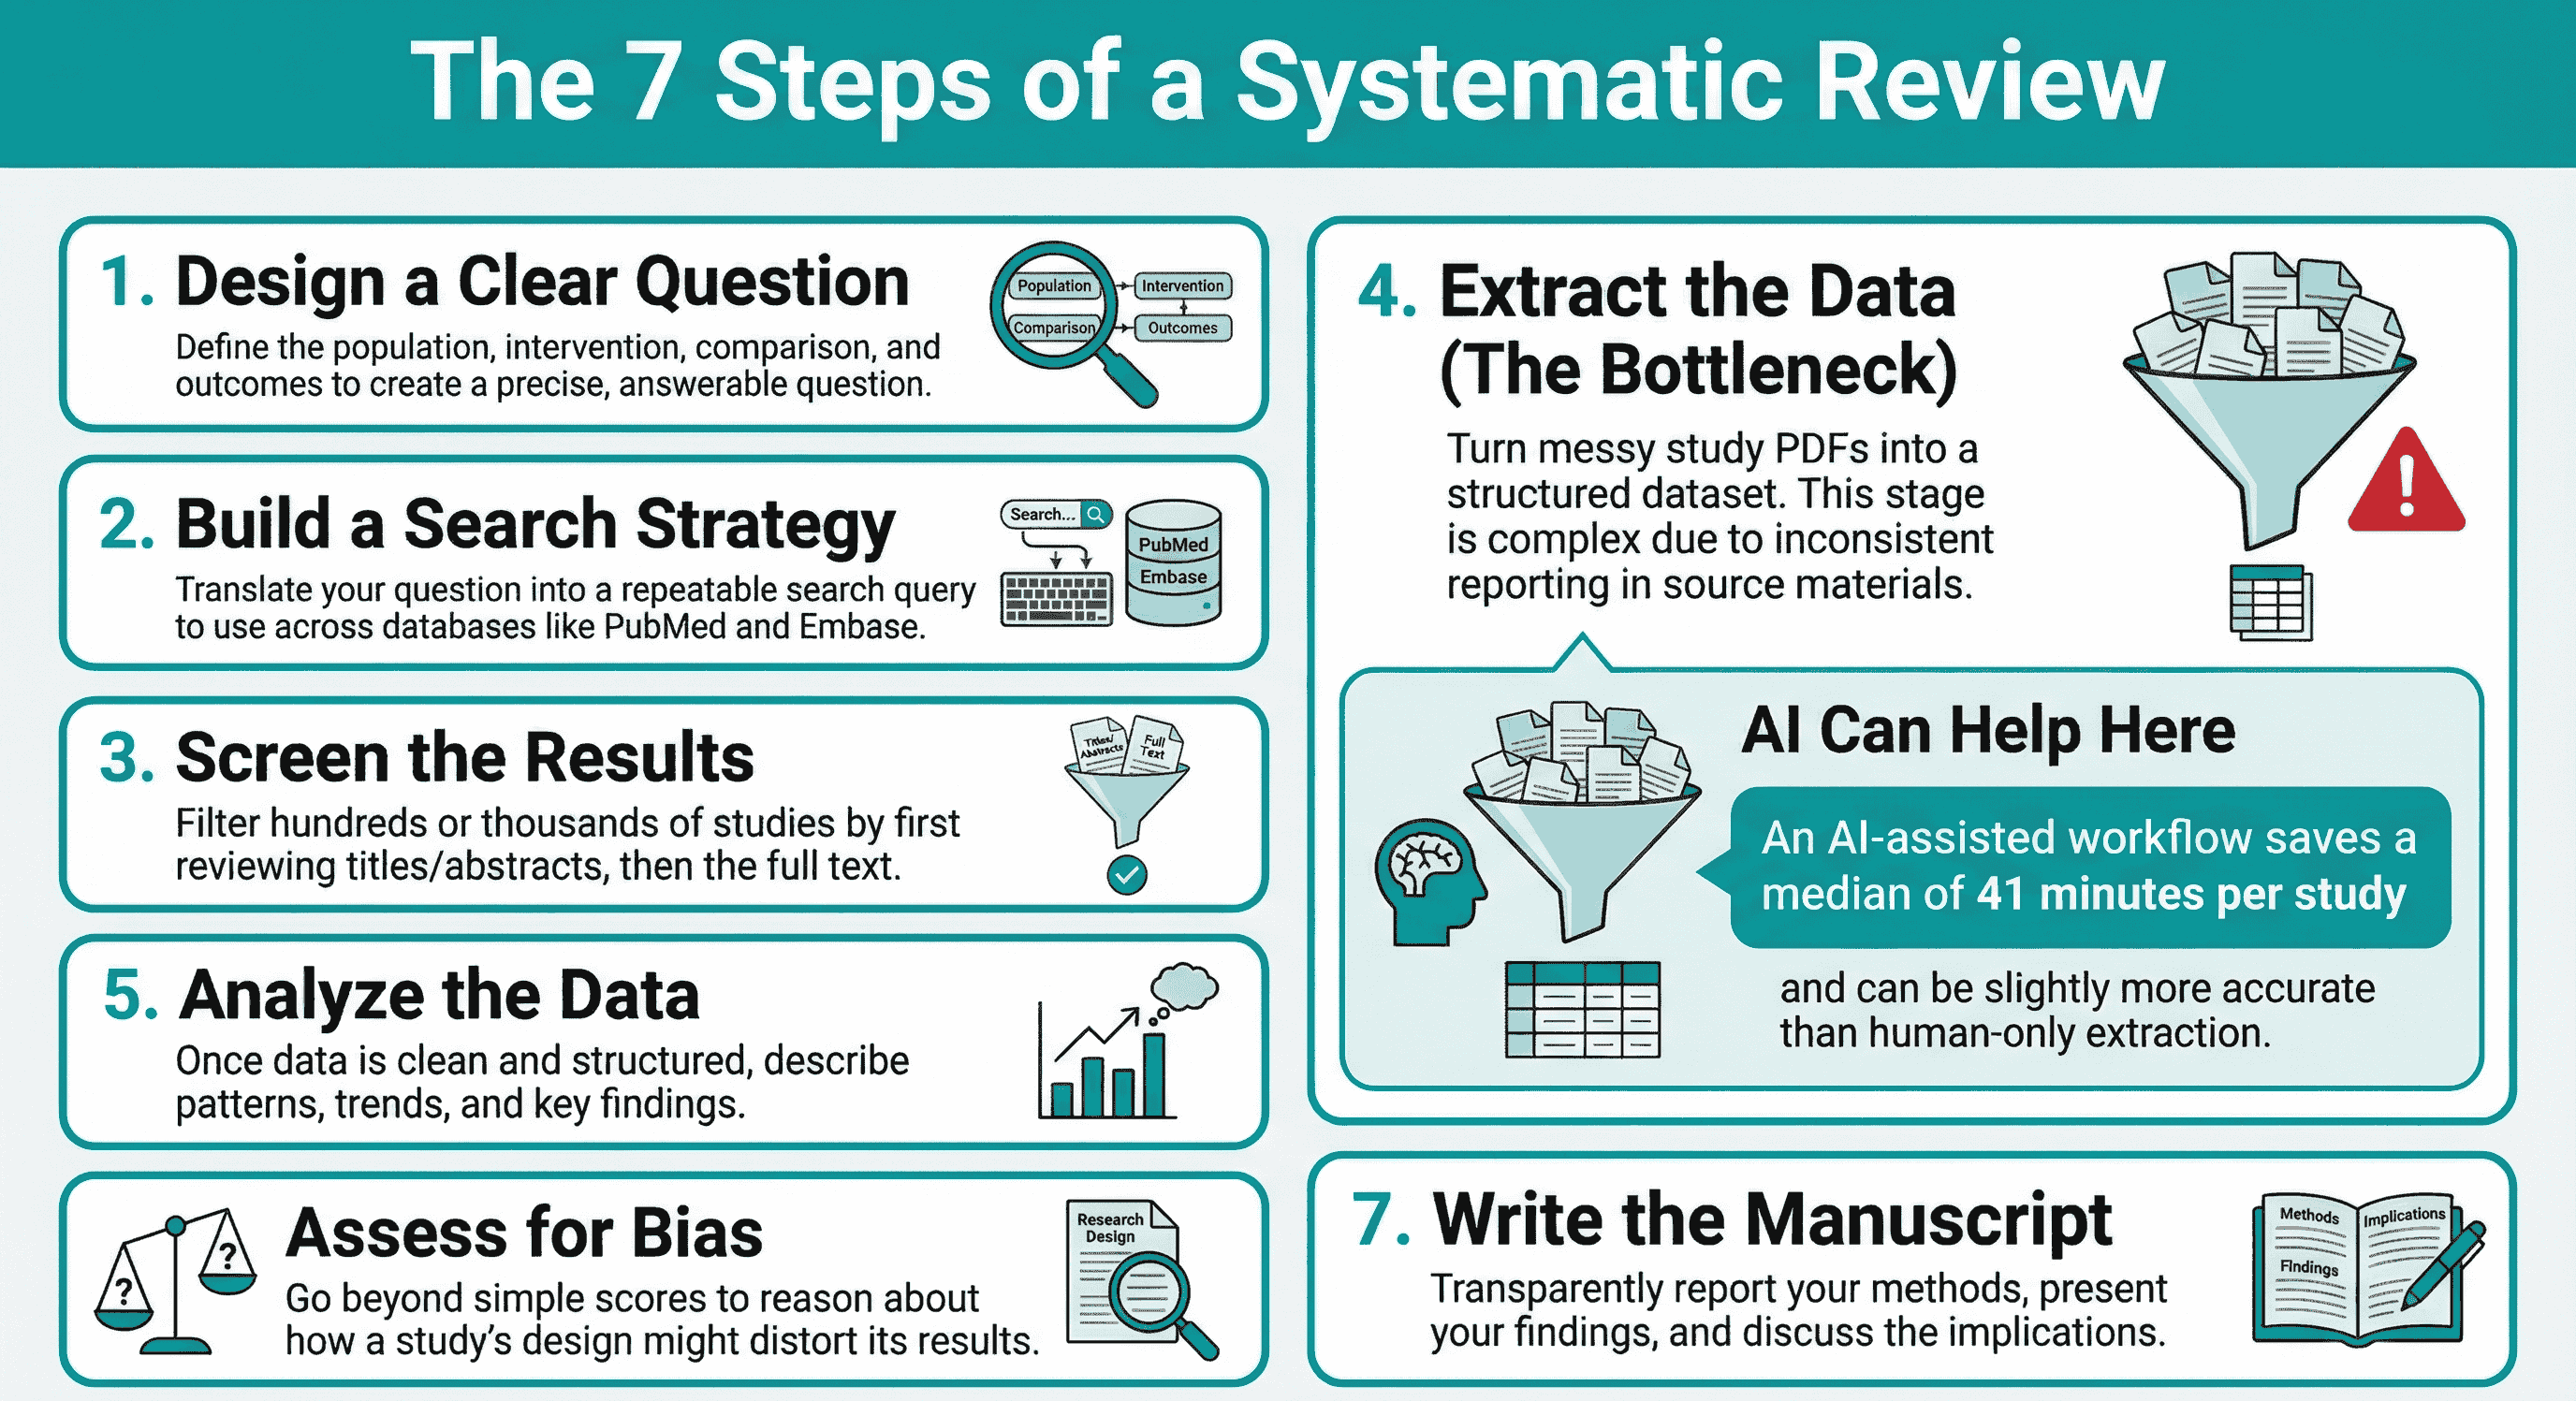
The 7 steps are:
- define the research question
- build the search strategy
- screen studies
- extract data
- analyze/synthesize evidence
- assess quality/risk of bias
- write and report the review
This guide is intentionally beginner-focused: each step includes what "done" looks like before moving on.
Step 1: define a precise research question
Clarify population, intervention/exposure, comparator, outcomes, and study designs.
Done when:
- inclusion/exclusion criteria are explicit
- main outcomes are pre-specified
- protocol scope is narrow enough to be feasible
Step 2: design a reproducible search strategy
Convert the question into search blocks with synonyms and Boolean logic. Run across selected databases and document exact strings.
Done when:
- another reviewer could rerun your strategy
- all major concept terms are represented
- date and language limits are justified
Step 3: screen titles/abstracts and full texts
Screen in two passes:
- title/abstract screening
- full-text eligibility check
Use predefined criteria and document exclusion reasons at full-text stage.
Done when:
- inclusion decisions are traceable
- disagreement resolution process is recorded
- final included-study set is stable
Step 4: extract structured data
Turn included papers into an analyzable table. Each row is a study; each column is one clearly defined variable.
Done when:
- critical outcomes, timepoints, and denominators are complete
- units are standardized or transformable
- extraction decisions are traceable
If this stage is slow or inconsistent, use:
- Best Practices for Data Extraction in Systematic Reviews
- How Best to Use EvidenceTableBuilder for Systematic Literature Reviews
Step 5: synthesize the evidence
Choose quantitative, qualitative, or mixed synthesis based on data structure and question.
Done when:
- synthesis method matches the question
- heterogeneity and limitations are described
- key findings are defensible and reproducible
Step 6: assess quality and risk of bias
Apply design-appropriate appraisal tools and integrate findings into interpretation.
Done when:
- risk-of-bias judgments are documented with rationale
- quality considerations influence conclusions
- sensitivity or certainty implications are clear
Tool selection guide: How to Choose the Right Quality Assessment Tool.
Step 7: write transparent methods and conclusions
Report what you did, what you found, and what remains uncertain.
Done when:
- methods are sufficiently transparent for replication
- limitations are explicit
- conclusions align with evidence strength
Common beginner pitfalls
- vague question scope
- underpowered search strategy
- inconsistent screening rules
- extraction columns designed too late
- quality assessment disconnected from synthesis
Most projects that stall do so at Step 4, not because teams are weak, but because extraction design was not locked early.
Final thought
Systematic reviews are manageable when treated as a staged workflow with clear handoffs. The goal is not perfection at every step; it is transparent, defensible progression through each step.
Related reading
Tags:

About the Author
Connect on LinkedInGeorge Burchell
George Burchell is a specialist in systematic literature reviews and scientific evidence synthesis with significant expertise in integrating advanced AI technologies and automation tools into the research process. With over four years of consulting and practical experience, he has developed and led multiple projects focused on accelerating and refining the workflow for systematic reviews within medical and scientific research.