Evidence table builder online: model‑ready, audit‑proof evidence tables for HEOR and HTA
Health economics and outcomes research (HEOR) teams need to move quickly without losing traceability. Your clinical evidence must be structured precisely to feed models, align with HTA templates (NICE, PBAC, CADTH, etc.), and withstand payer scrutiny. A capable extraction workflow—often combining screening, PDF extraction, spreadsheets, and modeling—standardizes fields, speeds up extraction, and produces a defensible evidence trail so clinical inputs can map cleanly to model parameters and dossier tables.
This article covers what to evaluate, how to run the workflow, and which outputs help modelers and HTA reviewers. It focuses on reproducibility, governance, timelines, and sign‑off because those levers reduce submission risk and rework in regulated settings.
Important note: This content is informational. It does not constitute regulatory advice. Always align with local HTA guidance and your internal SOPs.
What is an evidence table and why HEOR teams should use an online builder
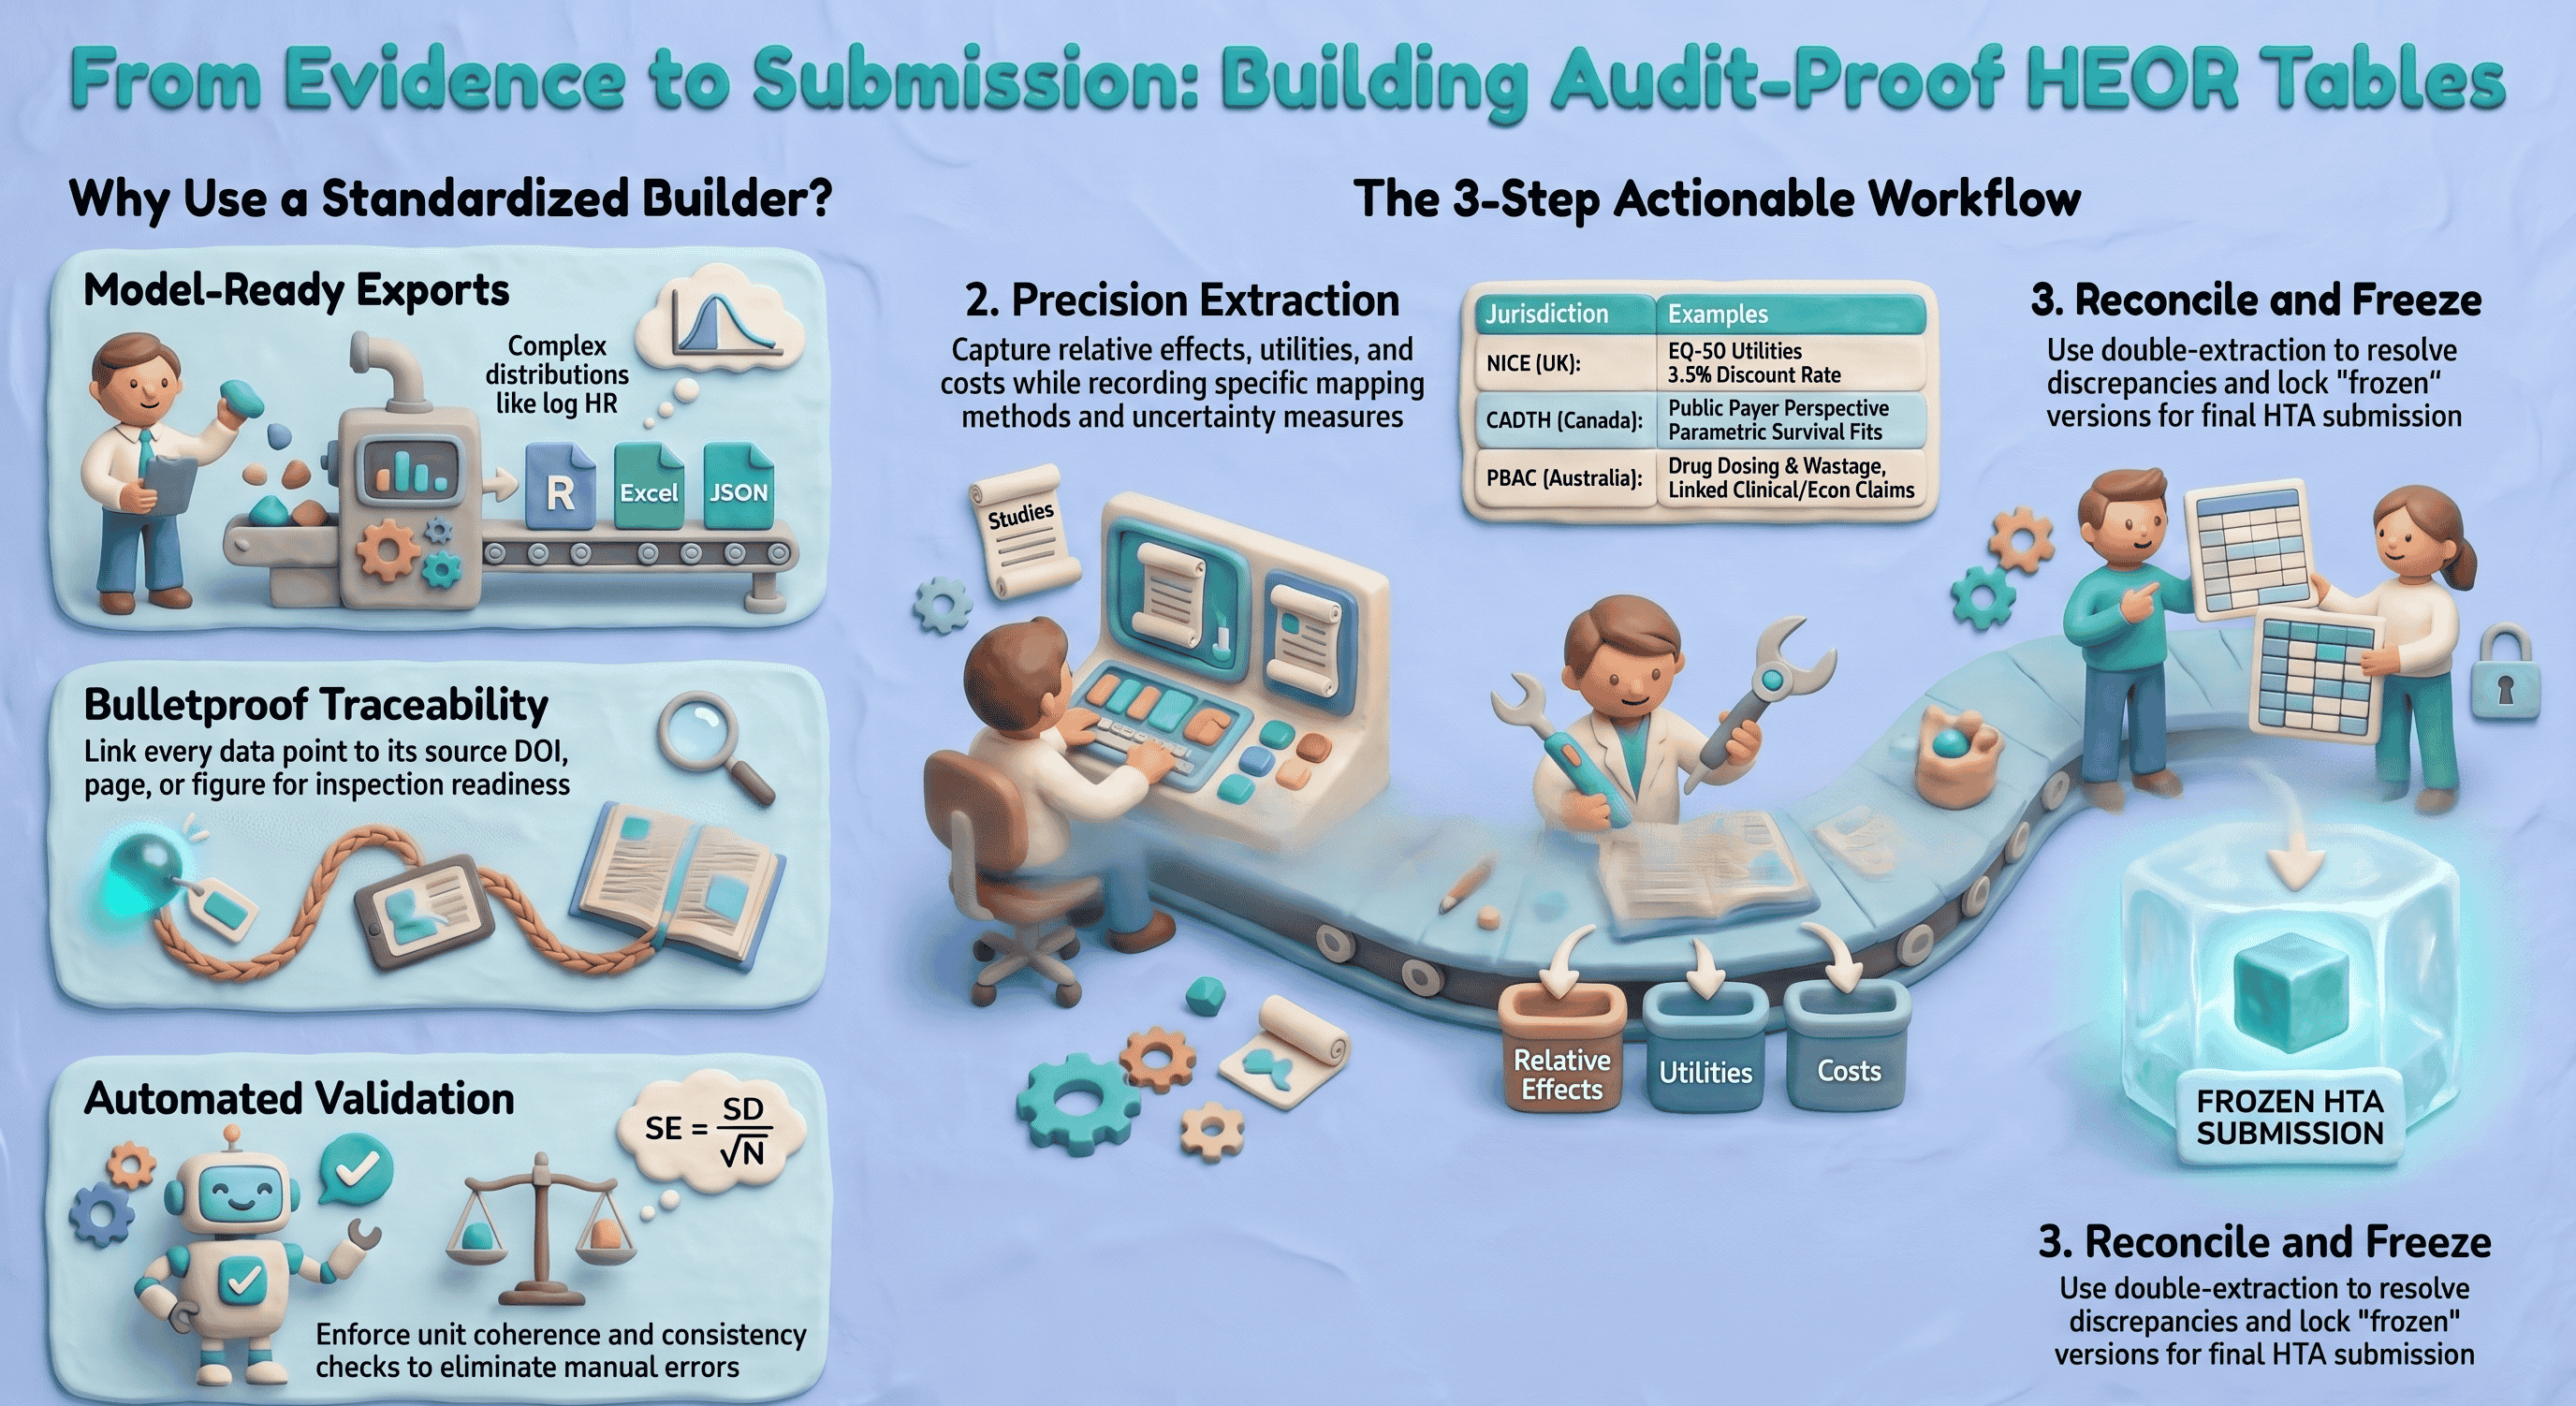
An evidence table is a structured dataset capturing study characteristics, results, and decision‑relevant parameters (e.g., baseline risks, relative effects, utilities, cost components) in a standardized format. It is the bridge between the clinical evidence base and the economic model, and much of the HTA dossier.
Why an online builder (vs unmanaged spreadsheets):
- Multiple sources, one structure. Map RCTs, observational studies, meta‑analyses, and HTA precedents into consistent fields (population, endpoints, time horizon, utilities, costs).
- Model input mapping. Capture the exact measures your model needs (e.g., transition probabilities, hazard ratios on the log scale with SE, health‑state utilities and decrements, cost components by perspective).
- Auditability end‑to‑end. Persist extraction notes, identifiers where you capture them (e.g., DOI, registry ID), and source‑linked evidence from the full text (verbatim quotes with page or figure references). Pair exports with your own change‑control or QMS if you need formal who‑edited‑what logs for inspection readiness.
Quick ROI examples:
- Faster model prep. Consistent, pre‑structured extraction cuts manual assembly time when your field set already matches what the model needs (e.g., effect sizes, uncertainty, utilities), even if you still reshape data in Excel or R before simulation.
- Consistent HTA submissions. Standard columns matched to NICE/CADTH/PBAC expectations reduce rework and sponsor/partner friction across indications.
Key features to evaluate in an evidence table builder online
When you evaluate an evidence table builder online for HEOR use, map each need below to your whole toolchain (screening, extraction, stats, modeling, dossier). Few products cover every line item alone. Evidence Table Builder today focuses on AI‑assisted extraction from uploaded PDFs into structured columns, with in‑app links back to the PDF and an Excel download that includes a Results sheet plus an Audit Trail sheet (verbatim evidence, location type/label, page, confidence, and review flags). Use the rest of this section as a procurement and design checklist; confirm what your shortlisted vendors actually ship.
At a glance: Evidence Table Builder
- PDFs in, tables out: Upload full-text papers (including batch runs), define extraction fields or pick a saved template, and run AI-assisted extraction against your protocol wording.
- Field budget per run: Builder currently supports up to 10 active extraction fields per run—tight enough for focused passes (e.g., efficacy one run, utilities/costs another) or combined questions when they fit.
- Verify before you ship: Open the in-app PDF viewer to jump to cited passages and highlights that match each answer’s audit trail.
- Excel handoff: Download a workbook with a Results sheet (one row per file, one column per field) and an Audit Trail sheet (verbatim quotes, location type/label, page, confidence, and review flags such as ambiguous or needs human review).
- Risk of bias elsewhere on the site: Formal profiles such as RoB 2, ROBINS-I, and Newcastle–Ottawa run in the separate Quality assessment workflow—use it alongside Builder when your SLR needs both structured tables and tool-specific appraisal outputs.
Required HEOR‑focused fields
- PICO/decision context
- Population, intervention, comparator(s), outcomes (PICO)
- Setting and line of therapy; geographic region(s)
- Perspective (payer, societal), currency and price year
- Time structure
- Time horizon (trial follow‑up and model horizon)
- Discount rates (costs, outcomes) with jurisdiction defaults
- Clinical outcomes
- Baseline risks/event rates; risk differences
- Relative measures: RR, OR, HR, rate ratio; clearly flagged as adjusted/unadjusted
- Survival data: median/mean OS/PFS, HR with CI, parametric fits (Weibull, log‑normal) if available
- Adverse events (grade, incidence), withdrawals
- Uncertainty
- SD, SE, CI, and N for all measures; capture scale (natural vs log)
- Correlations between endpoints if reported; covariance where applicable
- Utilities and health‑related quality of life
- Utility values by health state and adverse event; instrument (EQ‑5D‑3L/5L, SF‑6D), valuation set
- Mapping methods (e.g., EORTC to EQ‑5D), decrements, source and year
- Resource use and costs
- Components (drug acquisition, administration, monitoring, AE management, hospitalization)
- Unit costs, units per cycle, source, currency, price year
- Dose intensity, vial sharing assumptions; wastage logic
- Evidence quality and risk of bias
- RoB tool used (e.g., RoB 2, ROBINS‑I) and summary judgments
- Certainty/strength of evidence if applying GRADE
- Modeling notes
- Assumptions, imputations, conversions, and rationales
- Alignment to model health states, transition structure, and parameterization
Import and ingest
- Bibliographic and screening handoff
- RIS/EndNote/Zotero imports; deduplication
- Smooth handoff from screening tools and PRISMA logs. If you manage screening elsewhere, ensure your builder accepts a screened set and preserves inclusion/exclusion audit trails; see screening and PRISMA options at study-screener.com (SS) for study selection audit trails and PRISMA flow diagrams.
- Structured data
- CSV/Excel templates with data validation
- JSON for automated feeds from trial registries or internal data lakes
- Full‑text extraction support
- PDF capture and cite‑as‑you‑go; OCR where allowed; clear provenance for each extracted data point
Export formats
- Flat files for analysis and sharing
- CSV/Excel with consistent variable names and codebooks
- Programmatic formats
- R data frames (readr‑friendly), JSON for API‑based model inputs
- RevMan‑like tables for alignment with clinical evidence synthesis workflows
- Model‑specific structures
- Transition probability tables, parametric survival parameters (shape, scale), distributions (mean/SE or alpha/beta for beta; k/θ for gamma), utility matrices, and cost component sheets
Traceability and audit trail
- Persistent links to sources (DOI, PubMed, trial registry)
- Extraction notes with inline citations or page/figure numbers
- Attachments/screenshots of data tables and KM curves
- Automatic, immutable history: who added/edited, timestamps, change reason
- Study inclusion/exclusion reasons and link to PRISMA logs from your screening system (again, SS)
Collaboration, permissions, versioning, and APIs
- Role‑based access (extractor, reviewer, approver); single‑ and double‑extraction workflows
- Review/sign‑off states with electronic signatures and date stamps
- Branching and versioning of tables for scenario analyses; release tagging for submission freezes
- API endpoints to push vetted tables into modeling platforms and to pull updates back; webhooks for build pipelines
Validation and QC features
- Duplicate detection at study and outcome level (match by DOI/PMID/registry ID, fuzzy title/author/year)
- Field validation rules (e.g., SE = SD/sqrt(N), CI coherence; units enforceable)
- Controlled vocabularies and picklists (e.g., outcome terminologies, AE grades, country names, ATC codes)
- Consistency checks (e.g., cost currency must match price year; discount rates within jurisdictional norms)
- Reconciliation workflows for double extraction and discrepancy resolution
- Linkouts to upstream search and quality review tool listings at SystematicReviewTools.app (SRT) to align your extraction with validated search and appraisal workflows.
Common mistakes to avoid
- Mixing adjusted and unadjusted effects without flagging
- Losing the original measurement scale (e.g., treating log HR as HR)
- Omitting price year or currency, making costs non‑comparable
- Failing to record mapping methods for utilities
- Not preserving page/figure citations for extracted numbers
- Ignoring clustering or multi‑arm correlations when extracting standard errors
References and standards
- PRISMA 2020 for reporting evidence identification and selection
- CHEERS 2022 for economic evaluation reporting
- ISPOR‑SMDM Modeling Good Research Practices
- NICE Decision Support Unit (DSU) Technical Support Documents (e.g., TSDs on NMA, survival analysis)
- Local HTA methods guides (e.g., NICE, CADTH, PBAC, HAS)
Step‑by‑step: building a HEOR‑ready evidence table online (practical workflow)
- Import screened studies and register the decision context
- Gather all the PDFs of the included studies for your systematic literature review.
- Define scope: indication, comparators, perspective, jurisdictions, model horizon, discount rates.
- Set project taxonomies (outcome vocabulary, currency/year defaults, AE grading scale).
- Structure study arms and endpoints
- For each trial, define arms with exact regimens, dosing, line of therapy, and co‑meds.
- Map endpoints to standard measures:
- Binary: event counts, risks, risk differences, RRs/ORs (specify adjusted/unadjusted, model).
- Time‑to‑event: HRs with 95% CIs; note stratification/adjustment; capture parametric fits if reported.
- Continuous: mean change with SD/SE; instrument scales and MID thresholds.
- Record follow‑up windows and analysis populations (ITT, mITT, PP); note censoring rules.
- Capture uncertainty correctly and convert units
- Enter SD, SE, CI, and N where reported; the tool should compute the others and flag inconsistencies.
- SE = SD / sqrt(N) for independent observations (document deviations for paired/clustered data).
- For log‑scale effects (e.g., log HR), derive SE from CI: SE = (log(upper) − log(lower)) / (2 × 1.96).
- Units and scales
- Standardize units (e.g., mg, IU) and time bases (per cycle vs per year). The builder should enforce unit picklists and auto‑convert where safe.
- For survival, ensure time origin alignment (randomization vs index date).
- Correlations
- If multiple endpoints or time points are used jointly in the model, capture correlations if available; else, document assumed correlations for sensitivity analysis.
- Extract utilities and costs with modeling metadata
- Utilities
- Record instrument (e.g., EQ‑5D‑5L), value set (e.g., UK 2019), and mapping methods.
- Health states, decrements for AEs, and timing assumptions (onset, duration).
- Costs
- Resource use quantities and frequencies, unit costs (source, code), currency, price year.
- Dosing rules (per kg, BSA), dose intensity, vial sharing, wastage assumptions.
- Perspective‑specific inclusions/exclusions (societal vs payer).
- Document assumptions and transformations
- Where medians must be converted to means, or ranges to SDs, record the exact method and citation (e.g., Wan et al. 2014 for mean/SD estimation; Cochrane Handbook guidance).
- For survival digitization/parametric fitting, record software, distribution candidates, and goodness‑of‑fit criteria (AIC/BIC/visual fit).
- For indirect comparisons or network meta‑analysis inputs, cite DSU TSDs and note network structure and model class.
- Validate and reconcile
- Trigger double‑extraction reconciliation for key outcomes and costs.
- Run automated checks: unit coherence, CI/SE consistency, currency‑year required fields, duplicate detection.
- Move records to “Reviewer approved” and “Approver signed‑off” states with date/time and signature capture for governance.
- Export model‑ready datasets and methods appendix
- Export (typical program targets—your extraction tool may only supply part of this)
- Excel: many teams maintain separate tabs for parameters (values, distributions), utilities, costs, event risks, and treatment effects; copy or link from your evidence export into that workbook structure.
- R or JSON: often produced in-house or by a modeling platform after you finalize values and scales in Excel.
- Optional RevMan‑like tables if your organization aligns clinical and econ workflows tightly.
- Methods appendix
- Compile a methods log: search strategy references, inclusion criteria, extraction approach, transformation formulas, and an assumption register, aligned with PRISMA and CHEERS headings. Attach or reference your exported extraction tables and audit trail as evidence for dossier appendices or inspection readiness.
Common mistakes at this stage
- Exporting HRs instead of log HR and SE required by the model
- Omitting covariance between related parameters, leading to incorrect PSA draws
- Failing to lock a submission version (no frozen snapshot) before last‑minute edits
Integration and outputs that matter to payers and modelers
Sample export workflows (illustrative of what mature modeling groups often build around extracted evidence—not something every extraction product delivers out of the box)
- Excel
- Modelers receive a parameter workbook with named ranges (Value, SE, Distribution, Alpha/Beta) and a dictionary tab explaining units and sources.
- R
- A named list: parameters, utilities, costs, transitions, and metadata; plus code snippets (e.g.,
read_json,tibble::as_tibble) and checksums for integrity.
- A named list: parameters, utilities, costs, transitions, and metadata; plus code snippets (e.g.,
- TreeAge and template‑based models
- Transition matrices per cycle, cost/utility by state per cycle, and mapping keys from clinical arms to model states.
Submission‑ready HTA tables
- NICE
- Comparators and rationale; baseline risk, relative effects with CIs, utilities by health state (EQ‑5D aligned), cost components with 2023 GBP price year; discounting at 3.5% unless justified.
- CADTH
- Canadian price year, perspective (public payer), clear source attribution for unit costs, and parametric survival fits with justification if extrapolating beyond trial.
- PBAC
- Explicit linkage between clinical and economic claims; drug cost calculations reflecting dosing rules and wastage; sensitivity/scenario analyses clearly enumerated.
If you adopt an enterprise platform, ask whether it offers jurisdiction profiles to pre‑fill defaults (e.g., discount rates, currency/year) and flag deviations; otherwise maintain those defaults in your own master workbook or SOPs.
Audit trail examples HTA reviewers value
- Line‑item provenance
- Each parameter lists the exact table/figure/page and DOI; hover or click reveals a screenshot.
- Role‑based approvals
- Extracted by [Name], reviewed by [Name], approved by [Name]; timestamps and change logs.
- Versioned exports
- Submission package v1.3 (frozen on date), checksum ID; any later edits are new versions with diffs.
For upstream alignment (search translation, filters, critical appraisal), consult the curated workflow resources and quality review tool listings at SystematicReviewTools.app (SRT).
FAQ: evidence table builder online for HEOR
-
What makes an online evidence table builder “model‑ready”?
- In practice, “model‑ready” means your extraction schema matches the parameters the model consumes (including scale, e.g., log HR + SE), outputs are easy to verify against the full text, and you can hand off values into your parameter workbook or code. Evidence Table Builder supports that through configurable extraction fields or templates, PDF‑linked evidence, and Excel export (Results + Audit Trail). CHEERS/HTA appendix text still belongs in your controlled documents process; export tables become inputs to that narrative.
-
Can it handle non‑randomized evidence and network meta‑analysis inputs?
- Yes, provided you flag effect adjustment, confounders, and study design attributes, and capture the parameters your synthesis requires (e.g., arm‑based or contrast‑based inputs). Align with DSU TSD guidance and your synthesis plan.
-
How are utilities managed across instruments and jurisdictions?
- Store the instrument, valuation set, and mapping method explicitly. Maintain jurisdictional defaults (e.g., UK EQ‑5D value set) and document any cross‑walk or mapping, so payers can verify appropriateness.
-
How do we ensure cost comparability?
- Enforce currency and price year fields; document sources; apply jurisdiction‑appropriate discount rates. If rebasing prices, record the index and method used. Keep perspective explicit (payer vs societal).
-
What about audit trails and approvals?
- Distinguish source traceability (which passage supported each extracted value) from organizational sign‑off (who approved the table for submission). Use dedicated screening tools for PRISMA‑linked inclusion decisions, use extraction exports for line‑item evidence, and layer formal reviewer/approver roles, e‑signatures, and version freezes where your SOP or QMS requires them—often outside the extraction app itself.
-
Can it integrate with our model automatically?
- Usually via structured files (Excel is the common handoff) and your own scripts or ETL—not necessarily a native model API from the extraction vendor. Agree on parameter names, scales, and distributions, then map the export into your schema. Automated rebuild hooks (webhooks) are optional glue your IT team can add around finalized files.
-
How do we maintain speed without compromising quality?
- Reuse extraction templates for recurring indications or HTA packages; batch PDFs per run; prioritize human review on high‑impact fields and on anything flagged ambiguous or “needs review.” Double‑data entry and heavy validation rules remain valuable where your protocol demands them, whether inside a platform or in Excel.
-
Does this replace our systematic review process?
Disclaimer: Methodological choices (e.g., survival extrapolation, NMA models) must follow your analysis plan, HTA guidance, and internal SOPs. This article summarizes common HEOR needs but cannot cover all scenarios.
References and guidance
- PRISMA 2020; CHEERS 2022; ISPOR‑SMDM Modeling Good Research Practices
- NICE DSU Technical Support Documents; CADTH, PBAC, and other HTA manuals
Looking upstream? Explore workflow resources and quality review tool options at SRT. Need PRISMA‑compliant screening and selection audit trails? See SS. Then use Evidence Table Builder to draft structured, source‑linked evidence tables in Excel—the step where included full texts become reviewable answers plus an audit trail you can fold into your HEOR modeling and dossier workflow.
Tags:

About the Author
Connect on LinkedInGeorge Burchell
George Burchell is a specialist in systematic literature reviews and scientific evidence synthesis with significant expertise in integrating advanced AI technologies and automation tools into the research process. With over four years of consulting and practical experience, he has developed and led multiple projects focused on accelerating and refining the workflow for systematic reviews within medical and scientific research.